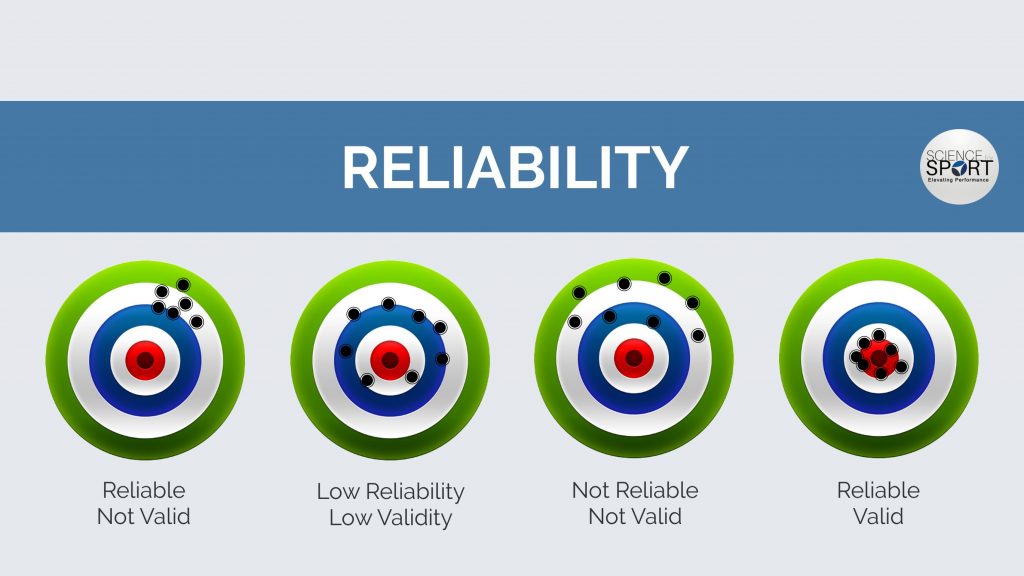
Reliability
Reliability is equated with a measuring instrument’s consistency or stability. If the same scale is administered repeatedly to the same individuals and it yields roughly the same set of responses, the scale is said to be reliable. For example, if you and your classmates were to take one of your course examinations several times and the average class grades were approximately the same each time, the test probably a reliable, measure of the class’s mastery of the materials covered by the question. on the examination. However, if the class average varies considerably from one test to another, the examination is probably unreliable.
Random error and reliability
Unreliable test scores result from random errors of measurement, produced by factors such as fatigue or carelessness. Random errors result responses that do not reflect a person’s “true’ knowledge or beliefs about the concepts beinz measured. Applied to a course examination random errors can occur when students whc know the correct answers carelessly select the wrong answers to multiple-choice or true false questions. Reliability, then, may be thought of as the relative absence of random errors from :he data yielded by a measuring instrument. The reliability of any set of data can range from 0. meaning no reliability at all, to signifying perfect reliability. If people’s responses contain no random error whatsoever, reliability is a perfect 1. However, if their responses consist completely of random error, reliability is 0.
Assessing reliability
Several procedures are available for testing the reliability of a measuring instrument. Recai. that response consistency is the key to a scale’s reliability; if the same people repeatedly re-spond to the same instrument in virtually the same way, the instrument is considered to be reliable. Three – sets of procedures are com-monly used to determine response consistency and thereby to estimate reliability: the test-retest method, the alternative-forms technique. .and the internal consistency method. Each
method produces a reliability index ranging from 0 to 1, with 1 signifying perfect reliability.
1. The test-retest method.
The test-retest ap-proach (sometimes called the “matching pairs” proceduye) is the most straight-forward of all reliability estimators. The same instrument is administered to the same group of people on two separate occasions, and the extent to which the two sets of scores are mutually consistent is determined. Re-searchers determine the direction and magnitude of response consistency by calculat-ing a reliability coefficient, a statistical index ranging -from 0 to 1, where 0 signifies no reliability and 1 indicates perfect reliability.
The test-retest method is useful and rela-tively easy to employ. However, it suffers from two limitations that can lead to either overestimation or underestimation of an in= strument’s reliability. First, the initial admin-istration of a measuring iristrument often sensitizes people to the second, prompting 3. them to remember questions and respond in the same way the second, time around. Recalling one’s original responses reduces natural random error and leads to an ar-tificially inflated reliability level. Second, people’s views may change between the first administration of an instrument and the re-test. In such a case, reliability will be under-estimated, since what appear to be random error fluctuations are in reality changes in true scores.
Although potentially damaging, these problems can be alleviated by setting a time period between test administrations that is long enough to diminish-the impact of mem-ory, but sufficiently short that people are unlikely to change their views on the con-cept being measured. Judgments about the ideal waiting period vary depending on the type and complexity of the instrument. some researchers recommend at least one full day but not more than a month between administrations.”
2.The alternative-forms method.
Designed to overcome the two flaws in the test-retest ap-proach, the alternative-forms method re-quires two parallel versions of the same in-strument. That is, the two instruments use different scale items to measure precisely the same concept. The two versions of the instrument are administered to the same group of people, often reversing the order of presentation for roughly one-half the group members. As with the test-retest method,’ the scores on the two forms are compared to assess response consistency. The principal problem with this ap-proach is the difficulty of constructing truly parallel versions of the’ same instrument. This drawback, along with the lack. of an adequate method for determining when one has achieved parallelism, reduces the other-wise important advantages, of the alter-native-forms approach over the test-retest method.
3.Internal consistency Methods.
Designed to surmount the problems associated with both the test-retest and alternative-forms approaches, the internal consistency method administers a single instrument to one group of people at the same time. After adminis-tration,. the researcher divides the original instrument into two or more subsets of questions and assesses the extent to which responses to each separate subset are consis-tent with one another. An early version of the internal consis-tency method, the split-halves approach, di-vides a measuring instrument into two equal parts and correlates the scores derived from each part for response consistency. A later and more sophisticated version of the alp-‘ Proach. Cronbach’s alpha coefficient method, randomly selects multiple pairs of subsets from an instrument, correlates each pair’s scores, and then uses the composite correla-tion between all the paired subsets as an index of the total instrument’s internal con-sistency.” Most standard computer software for the social sciences contains subroutines for computing alpha coefficients and other indices of internal consistency.